At Liv Hospital, we use PET scanning to see how tissues change in the body. It helps us understand FDG uptake patterns in healthy tissues. This is important for telling the difference between normal and abnormal activity.
PET scanning is key in medical diagnosis. It helps us find and track different conditions. The 18F FDG PET scan shows the body’s metabolic activity. This helps us spot areas of concern.Explore 7 key features of normal PET scan images and understand FDG uptake patterns in healthy tissue scans.
By knowing the FDG uptake in different organs, we can better understand PET scan results. This leads to more accurate diagnoses and better care for patients.
Key Takeaways
- Understanding normal PET scan images is key to accurate diagnosis.
- PET scanning is a vital tool in medical diagnosis, detecting physiological and pathological changes.
- FDG uptake patterns in healthy tissues serve as a reference for identifying abnormalities.
- The 18F FDG PET scan is a significant diagnostic tool, highlighting metabolic activity.
- Recognizing predictable FDG uptake in organs is key to interpreting PET scan results effectively.
The Fundamentals of PET Scanning and FDG Metabolism

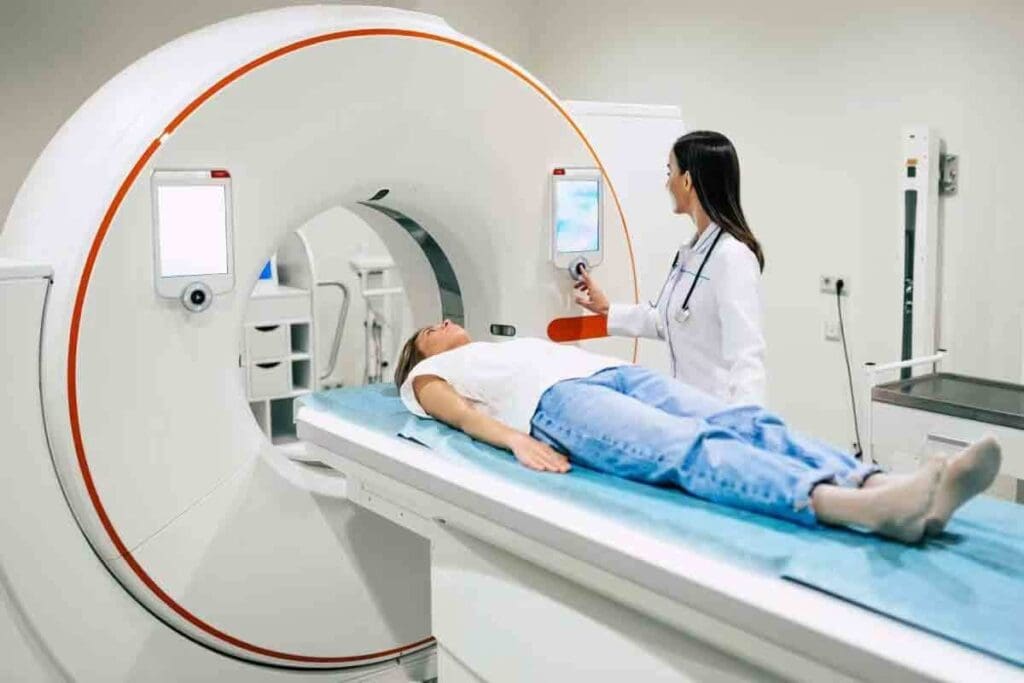
To understand the importance of normal PET scan results, we need to know how PET scanning works. PET (Positron Emission Tomography) scanning is a complex medical imaging method. It shows how tissues in the body are working.
How PET Scans Work: The Science Behind the Images
PET scans detect energy from a radioactive tracer injected into the body. This tracer, usually 18F-FDG (Fluorodeoxyglucose), goes to areas with lots of activity, like growing cancer cells. The PET scanner picks up the energy, making detailed images of the body’s metabolic processes.
18F-FDG: The Standard Radiotracer in Molecular Imaging
18F-FDG is a glucose-like substance that cells take in instead of regular glucose. Cancer cells, which use more glucose than normal cells, show up on PET scans. Studies show that 18F-FDG is key in finding and tracking cancer with PET scans.
Glucose Metabolism and FDG Uptake Correlation
The link between glucose use and FDG uptake is key to understanding PET scan results. Cells that use a lot of glucose, like some cancer cells, will show more FDG uptake. But knowing what’s normal is important to tell if uptake is a sign of cancer or not.
| Tissue Type | Typical FDG Uptake | Clinical Significance |
| Normal Brain Tissue | High | Expected due to high glucose metabolism |
| Cancerous Tissue | High | Potential malignancy |
| Inflammatory Tissue | Moderate to High | May mimic cancer or indicate infection/inflammation |
Normal PET Scan Images: Baseline Patterns and Characteristics

Understanding normal PET scan images is key to accurate diagnosis and treatment planning. These images help us know what’s healthy. This way, we can spot problems and make smart decisions.
Standard Appearance of Healthy Tissue on PET Scans
Healthy tissues show specific patterns on PET scans. For example, the brain has high FDG uptake because it uses a lot of glucose. On the other hand, the lungs usually have low FDG uptake, appearing “cold” on scans.
Other organs like the liver, spleen, and heart also have unique FDG uptake patterns. The liver has moderate uptake, while the spleen’s uptake is similar or slightly lower. Knowing these patterns is vital for accurate PET scan interpretation.
SUV Values: Quantifying Normal FDG Uptake
Standardized Uptake Values (SUV) measure FDG uptake in tissues. SUV values help standardize PET scan interpretation by providing a normalized measure of radioactivity. Normal SUV values vary among different organs and tissues.
For instance, the liver’s SUV values usually range between 2.0 and 2.5. Other organs li, like the brain and heart, have their own expected SUV ranges. These ranges help determine if FDG uptake is normal.
| Organ/Tissue | Typical SUV Range |
| Liver | 2.0 – 2.5 |
| Brain | 6.0 – 8.0 |
| Heart | Variable, often higher than liver |
| Lungs | Low, typically |
Symmetry and Distribution Patterns in Normal Scans
Normal PET scans show symmetric FDG uptake in organs and tissues. Asymmetry can signal a problem, but some normal variations can also cause it. For example, the brain’s cerebral hemispheres should have symmetric FDG uptake. The heart’s uptake can vary based on fasting state and other factors.
The body’s FDG distribution is also key for interpreting PET scans. Normal patterns include high uptake in the brain, moderate uptake in the liver and spleen, and variable uptake in the heart and muscles. Knowing these patterns helps us spot abnormal uptake that may indicate disease.
Brain and Central Nervous System FDG Distribution
Knowing how FDG spreads in the brain and central nervous system is key to reading PET scans. The brain uses a lot of glucose for energy. So, FDG-PET scans help us see how well the brain works and how it uses energy.
Cerebral Cortex: High Metabolic Activity Regions
The cerebral cortex is super busy. It handles sensory info, movement, and thinking. It uses a lot of energy, which shows up on FDG-PET scans. Frontal, parietal, temporal, and occipital cortices are the busiest. They’re important for brain functions, and their activity can tell us about brain health.
Basal Ganglia and Thalamus Uptake Patterns
The basal ganglia and thalamus are key to movement and sensing. They don’t use as much energy as the cortex. The basal ganglia help with movement and learning. The thalamus sends signals to the cortex. Knowing how these areas use FDG helps spot problems.
| Region | Typical FDG Uptake | Function |
| Cerebral Cortex | High | Processing sensory information, controlling movement, and higher-level cognitive functions |
| Basal Ganglia | Moderate | Regulating voluntary motor movements, procedural learning, routine behaviors, and emotion |
| Thalamus | Moderate | Relay station for sensory and motor signals |
Age-Related Variations in Brain FDG Distribution
How FDG spreads in the brain changes with age. Kids have more active brains than adults. As we get older, some brain areas might use less energy. It’s important to know these changes to avoid mistakes in PET scans. For example, older people might show less activity in some areas because of aging.
“The interpretation of FDG-PET scans requires a complete understanding of brain metabolism and how it changes with age.”
— Expert in Nuclear Medicine
Understanding how FDG spreads in the brain helps doctors diagnose and treat brain conditions better. This knowledge is key to using FDG-PET scans correctly.
Cardiovascular System: Normal Myocardial FDG Uptake
Myocardial FDG uptake changes a lot based on fasting status. Knowing these changes is key to rthe ight PET CT scan reading.
Fasting vs. Non-Fasting Heart Uptake Patterns
Fasting greatly affects myocardial FDG uptake. In fasting, the heart uses fatty acids more, which might lower FDG uptake. But when not fasting, the heart uses glucose more, raising FDG uptake.
The heart’s FDG uptake pattern changes a lot between fasting and not fasting. This change is very important for correct PET CT scan reading.
| Fasting State | FDG Uptake Pattern |
| Fasting | Reduced FDG uptake due to the utilization of fatty acids |
| Non-Fasting | Increased FDG uptake due to glucose utilization |
Factors Affecting Myocardial FDG Distribution
Many things can change myocardial FDG distribution, including:
- Metabolic State: How much the heart uses glucose versus fatty acids changes FDG uptake.
- Insulin Levels: More insulin means more glucose in the heart, affecting FDG.
- Cardiac Workload: More work for the heart means more FDG uptake because of more energy needed.
Knowing these factors is vital for correct PET CT scan reading, mainly for heart conditions.
Abdominal Organ FDG Distribution in Normal PET CT Images
PET CT scans give us insights into how active abdominal organs are. Knowing how FDG is usually spread in these organs helps us spot any odd patterns. These patterns might show if something is wrong.
Liver, Spleen, and Pancreas: Expected Uptake Levels
The liver, spleen, and pancreas have their own ways of showing FDG on PET CT scans. The liver is usually quite active, showing a lot of FDG uptake. The spleen’s uptake is similar to the liver’s. But the pancreas tends to have less FDG.
We use the Standardized Uptake Value (SUV) to measure FDG in these organs. The SUV helps us compare scans from different times and people. Here’s what the SUV ranges are for these organs:
| Organ | Expected SUV Range |
| Liver | 2.0 – 3.0 |
| Spleen | 1.5 – 2.5 |
| Pancreas | 1.0 – 2.0 |
Gastrointestinal Tract Variability in 18F FDG PET Scans
The GI tract’s FDG uptake varies because of its natural activity. This activity can be low or high, depending on things like bowel movement, inflammation, or lymphoid tissue.
It’s important to remember that the GI tract’s FDG uptake can change. This is normal and can be affected by things like eating or bowel prep.
Renal and Urinary Tract: Excretion Patterns
The kidneys and urinary tract play a role in getting rid of FDG. The kidneys take up a lot of FDG as they filter it out. The urine in the kidneys, ureters, and bladder also has a lot of FDG, which is normal.
Knowing how FDG is usually excreted helps us not mistake it for disease on PET CT scans.
Musculoskeletal System and Normal Lung PET Scan Findings
It’s important to know what normal PET scan results look like, mainly for the musculoskeletal system and lungs. When we look at PET scans, we need to know what’s normal in different tissues.
Let’s start with the musculoskeletal system. This includes muscles and bone marrow. Skeletal muscle FDG uptake changes a lot based on how active you are and your health.
Skeletal Muscle: Activity-Related Uptake Variations
Skeletal muscle’s FDG uptake changes with activity. For example, muscles used right before the PET scan might show more FDG. This is true for muscles in the neck, shoulders, and legs if you’ve been active or are feeling tense.
Here’s a table showing how FDG uptake in skeletal muscle changes under different conditions:
| Condition | FDG Uptake Level | Typical Causes |
| Resting State | Low | Relaxed muscles, minimal physical activity |
| Active State | High | Recent exercise, muscle tension |
| Pathological State | Variable | Inflammatory myopathies, muscle injury |
Bone Marrow: Normal Distribution Patterns
Bone marrow FDG uptake is also key in PET scans. Normally, it has a low to moderate FDG uptake. But this can change with things like chemotherapy, G-CSF, or certain blood disorders.
Pulmonary Parenchyma: Low Background FDG Activity
In the lungs, normal tissue usually has low FDG activity. This helps doctors spot problems like infections, inflammation, or cancer by looking for high FDG uptake.
In short, knowing what’s normal in PET scans for the musculoskeletal system and lungs is key to making accurate diagnoses. By understanding the usual patterns of FDG uptake, doctors can tell the difference between normal and abnormal findings.
Common Physiologic Variants and Possible Pitfalls
Understanding PET scans means knowing about common physiologic variants and pitfalls. It’s key to tell normal variations from real health issues.
Brown Fat Activation: A Frequent Normal Variant
Brown fat activation is a normal thing seen in PET scans. It shows up as symmetrical areas of high FDG uptake in the neck and other areas. Brown fat activation is more common in cold places and in people with low BMI. It’s important to know this to avoid thinking it’s a disease.
Inflammatory and Infectious Processes Mimicking Pathology
Inflammatory and infectious issues can make FDG uptake look like cancer. For example, granulomatous diseases like sarcoidosis can show a lot of FDG activity. This makes reading PET scans tricky, even more so in patients with known inflammatory conditions. A study on the National Center for Biotechnology Information website helps understand these challenges.
| Condition | FDG Uptake Pattern | Potential Misinterpretation |
| Granulomatous disease | Intense, multifocal uptake | Malignancy or metastatic disease |
| Recent surgery or trauma | Focal uptake at the surgical site | Tumor recurrence |
| Infectious processes | Variable uptake patterns | Abscess or malignancy |
Medication and Treatment Effects on FDG Distribution
Some medicines and treatments can change how FDG is distributed. For instance, granulocyte-colony stimulating factor (G-CSF) can make bone marrow take up more FDG. Insulin can make tumors take up less FDG. Knowing this helps us read PET scans more accurately.
By grasping these common physiologic variants and pitfalls, we can better interpret PET scans. This leads to better care for our patients.
Interpreting PET Scan Results: Normal vs. Abnormal Findings
Understanding PET scan results is key. It’s about knowing what’s normal and what’s not. PET scans help doctors a lot, but they need to know the difference.
Key Indicators of Pathological FDG Uptake
Spotting problems on PET scans is all about the uptake pattern. Look for these signs:
- Focal areas of increased uptake
- Asymmetric distribution of FDG
- Uptake that is significantly higher than the surrounding tissue or background
For example, “focal FDG uptake in certain areas can mean cancer.”
“FDG PET/CT is vital in cancer care. It helps with diagnosis, planning, and tracking treatment.”
Comparing Sequential Scans: Understanding Changes Over Time
Looking at PET scans over time is important. It shows how diseases change or get better. This helps doctors decide on the best treatment.
When looking at scans, watch for SUV value changes, lesion sizes, and FDG uptake patterns. A drop in FDG uptake means treatment is working. An increase might mean the disease is getting worse.
Integration with Other Imaging Modalities for Accurate Diagnosis
PET scans work best with other imaging, like CT and MRI. This combo gives a clearer picture of what’s going on. It mixes metabolic info from PET with detailed images from CT or MRI.
For instance, PET/CT helps pinpoint where FDG uptake is abnormal. This makes finding small problems easier and helps understand how widespread a disease is.
Using PET scans with other imaging is a big step forward. It helps doctors give better, more precise care.
Conclusion: The Importance of Recognizing Normal FDG Uptake Patterns
Knowing what normal FDG uptake looks like is key to accurate PET scan readings. This knowledge is vital for good patient care and correct diagnosis. We’ve looked at PET scanning basics, how FDG works, and what normal PET scans look like.
We’ve also talked about how different body parts show up on scans. This helps doctors spot any issues early. It’s important to know what healthy tissue looks like on scans, and how to tell if something’s off.
Understanding SUV values and how FDG spreads in the body is also critical. This way, doctors can make better choices for their patients. We’ve also covered how some normal things can look like problems on scans, making it even more important to read them carefully.
By using what we know about normal scans with other medical info, we can get better at diagnosing. This leads to better care for patients. As we keep improving in molecular imaging, knowing about normal scans is more important than ever. It helps us make patients’ lives better.
FAQ
What is a normal PET scan image?
A normal PET scan image shows predictable FDG uptake in organs. This is key to telling normal from abnormal activity. It usually shows symmetrical and consistent FDG distribution.
How does PET scanning work?
PET scanning uses a radiotracer, like 18F-FDG, which goes to active areas. The PET scanner catches the radiation from the tracer. This creates images showing how different tissues are working.
What is the role of 18F-FDG in PET scanning?
18F-FDG is the main tracer in PET scans. It acts like glucose, showing where tissues are most active. This helps doctors see metabolic activity in various tissues.
How is glucose metabolism correlated with FDG uptake?
Glucose metabolism and FDG uptake are closely linked. Where glucose is used a lot, FDG will also be found in high amounts. This shows up on PET scans.
What are normal SUV values for FDG uptake?
Normal SUV values for FDG uptake vary by organ and tissue. SUV values help measure FDG uptake. Higher values mean more activity.
How does fasting versus non-fasting affect myocardial FDG uptake?
Fasting and non-fasting affect FDG uptake in the heart differently. Fasting usually leads to higher uptake. Non-fasting can show different patterns.
What are common physiologic variants that can be seen on PET scans?
Physiologic variants include brown fat activation, causing high FDG uptake in the neck and upper torso. Other variants might show different uptake in the gut and muscles.
How can PET scan results be interpreted to distinguish between normal and abnormal findings?
To understand PET scan results, knowing normal FDG uptake and variants is key. Abnormal findings are usually asymmetrical or very high uptake, suggesting disease.
What is the importance of comparing sequential PET scans?
Comparing PET scans over time is vital. It shows how FDG uptake changes, helping track disease or treatment response.
How are PET scans integrated with other imaging modalities for accurate diagnosis?
PET scans are often combined with CT or MRI. This gives a full view of anatomy and metabolism. It helps make more accurate diagnoses and treatment plans.
What are the implications of recognizing normal FDG uptake patterns for patient care?
Knowing normal FDG uptake patterns is critical for accurate PET scan interpretation. It’s key for patient care, helping doctors make better treatment choices and improve outcomes.
References
- Vangu, M. D. T., et al. (2022). F-18 FDG PET/CT imaging in normal variants, pitfalls, and physiological uptake patterns in the abdomen and pelvis. Seminars in Nuclear Medicine. Retrieved from https://pmc.ncbi.nlm.nih.gov/articles/PMC11440875/


