
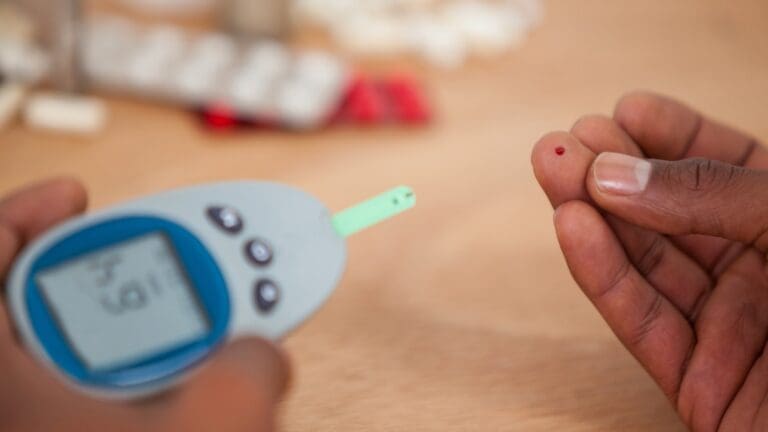
A DTPA scan is a test that checks how well your kidneys work. At Liv Hospital, we use it to see if your kidneys are okay. It helps us find any problems early.

This test uses a special dye that shows up on scans. It helps us see if your kidneys are filtering waste properly. Knowing how to read these results helps you take care of your kidneys better. Our team is here to help you understand your results and care for your kidneys.
Key Takeaways
- DTPA scan provides real-time assessment of kidney function.
- Accurate interpretation of results is key for kidney health.
- Liv Hospital’s team offers caring and expert care.
- The test uses a radioactive dye to check kidney work.
- Understanding DTPA scan results helps spot kidney problems early.
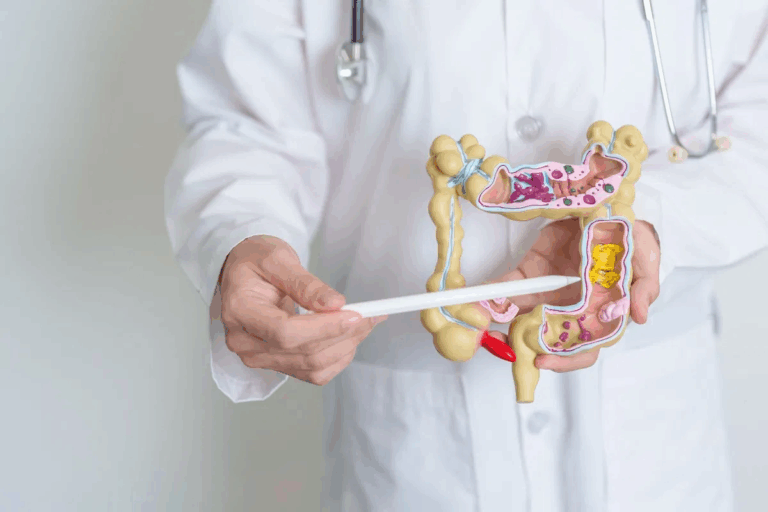
The Fundamentals of DTPA Scan of Kidney

To understand DTPA scan results, knowing the basics is key. The DTPA scan is a tool in nuclear medicine. It checks kidney function and spots renal issues.
What is a DTPA Scan and Its Purpose in Nuclear Medicine
A DTPA scan uses a radioactive tracer to see how kidneys work. It mainly checks the glomerular filtration rate (GFR). This rate shows how well kidneys filter waste.
Doctors use it to find kidney problems like blockages or damage.
The Science Behind 99mTc-DTPA as a Radioactive Tracer
The DTPA scan uses 99mTc-DTPA as its tracer. This tracer is safe and works well for imaging. It’s filtered by the kidneys, showing how they function.
Key Parameters Measured in Kidney Scintigraphy
Kidney scintigraphy, like DTPA scans, looks at several important things. It checks the GFR, blood flow, and how the kidneys handle the tracer. These help find issues like blockages or scarring.
Essential Preparation for DTPA Scan Interpretation

To get the most out of DTPA scan results, we must prepare well. We need the right tools and information before we start.
Required Equipment and Software for Analysis
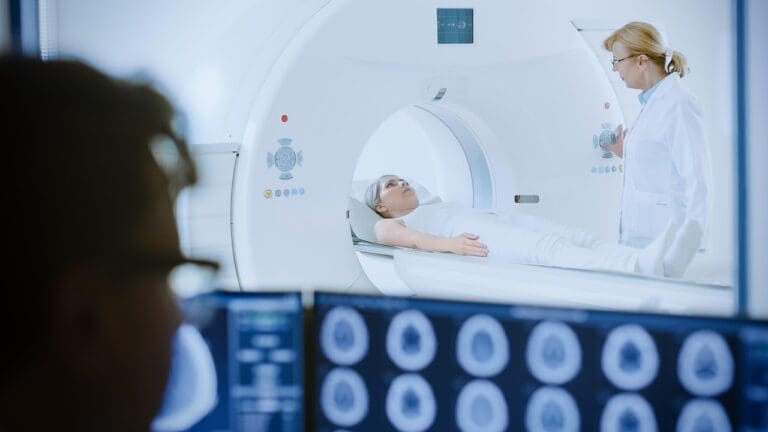
We need special equipment and software to analyze DTPA scans. A gamma camera is used to capture images. We also need software to process and analyze the data.
The software should help us create time-activity curves and calculate important values like the glomerular filtration rate (GFR). Advanced software features can make our interpretations more accurate.
Gathering Relevant Patient Clinical Information
It’s important to gather all the patient’s clinical information. This includes their medical history, current symptoms, and any past renal scans or treatments.
Having all this information helps us understand the scan results better. Knowing about the patient’s kidney function and any kidney diseases is key.
| Clinical Information | Relevance to DTPA Scan Interpretation |
| Medical History | Helps identify pre-existing conditions affecting renal function |
| Current Symptoms | Assists in correlating symptoms with scan findings |
| Previous Renal Scans | Provides baseline data for comparison |
Pre-Interpretation Quality Control Measures
Before we interpret the DTPA scan, we must check the data quality. We verify the radiotracer was given correctly and look for any technical problems during the scan.
Quality control is vital to avoid misinterpretation due to technical mistakes. We also check if the patient was properly prepared, like being well-hydrated.
By following these steps, we can make sure our DTPA scan interpretations are accurate. This leads to better care for our patients.
Step 1: Analyzing the Renal Perfusion Phase
Looking at renal perfusion is the first step in understanding a DTPA scan. It gives us important info about kidney health. The renal perfusion phase is key in checking how well the kidneys work. It shows us how much blood is flowing to the kidneys.
Identifying Normal vs. Abnormal Perfusion Patterns
Normal kidney perfusion shows a quick uptake of the tracer, then a slow drop as it filters through the glomeruli. But, abnormal patterns might mean less blood flow. This could be due to many reasons like renovascular hypertension or kidney problems.
Some signs of abnormal perfusion include:
- Delayed or Reduced Uptake: Shows possible blood flow issues to the kidney.
- Asymmetry: If the two kidneys don’t take in the tracer equally, it might mean one kidney is sick.
- Poor Cortical Perfusion: Could mean chronic kidney disease or other diseases affecting the kidney tissue.
Quantitative Assessment Techniques for Blood Flow
There are ways to measure how much blood flows through the kidneys. These include:
- Hilus-to-Parenchyma Ratio: This compares the tracer uptake in the renal hilus to the rest of the kidney.
- Renal Blood Flow Index: This calculates how fast the tracer is taken in, showing the kidney’s blood flow rate.
These methods help doctors accurately diagnose and treat kidney blood flow issues.
Recognizing Common Perfusion Abnormalities
Some common kidney blood flow problems seen in the renal perfusion phase are:
- Renovascular disease
- Kidney transplant dysfunction
- Chronic kidney disease
Spotting these problems early is key for quick treatment and care.
Step 2: Calculating and Evaluating Glomerular Filtration Rate
The glomerular filtration rate, or GFR, shows how well our kidneys work. It’s found from DTPA scan data. GFR tells us how much fluid the kidneys filter from the blood into the Bowman’s capsule each minute. This is key for checking if the kidneys can remove waste from the blood.
Methods for GFR Determination from DTPA Data
To figure out GFR from a DTPA scan, we look at how much 99mTc-DTPA the kidneys take in. The rate of uptake shows the GFR. We use methods like the Gates’ method, which is simple and reliable. It measures the count rate of the tracer in the kidneys at first and compares it to a standard.
For a deeper look, studies in nephrology journals show how accurate these methods are. They help us understand how well the kidneys are working.
Understanding Normal GFR Values and Age-Related Variations
Normal GFR values change with age, sex, and body size. A GFR over 90 mL/min/1.73m is normal. But, GFR goes down as we get older. For example, a 40-year-old might have a lower GFR than a 20-year-old. Knowing these changes helps us understand GFR results better.
Clinical Significance of Reduced GFR Findings
A lower GFR means the kidneys aren’t working right. This can happen for reasons like chronic kidney disease, diabetes, or high blood pressure. A low GFR is important because it tells us we need to watch the patient more closely. We might need to change their lifestyle or start treatments to slow the disease.
| GFR Category | GFR Value (mL/min/1.73m2) | Clinical Implication |
| Normal or High | >90 | Normal kidney function |
| Mildly Decreased | 60-89 | Mild kidney damage; monitor kidney function |
| Moderately Decreased | 30-59 | Moderate kidney damage; manage underlying causes |
| Severely Decreased | 15-29 | Severe kidney damage; consider renal replacement therapy |
| Kidney Failure | End-stage renal disease; likely requires dialysis or transplant |
By accurately calculating and evaluating GFR from DTPA scan data, healthcare providers can make informed decisions about patient care. They tailor management strategies to the individual’s kidney function level.
Step 3: Interpreting Renogram Time-Activity Curves
The renogram shows how kidneys work over time. It’s a key tool for checking kidney health. Time-activity curves help us see how kidneys handle substances.
The Three Phases of a Normal Renogram
A normal renogram has three main parts. These are the perfusion, uptake, and excretion phases.
- The perfusion phase is when the tracer first enters the kidney.
- The uptake phase shows the tracer building up, which means the kidney is working right.
- The excretion phase is when the tracer leaves the kidney, showing it can get rid of waste.
“A normal renogram starts fast, peaks, and then slowly goes down,” say nuclear medicine experts. Knowing these phases helps spot problems.
Recognizing Pathological Curve Patterns in Renography
Some renogram patterns point to kidney issues. These can include:
- Delayed or missing perfusion
- Long uptake phase
- Poor or missing excretion
These signs might mean blockages, narrowed arteries, or serious kidney damage.
It’s very important to understand these patterns for diagnosis and treatment. For example, a bad excretion phase might mean a blockage. This could need more tests or treatment.
Quantitative Analysis of Key Curve Parameters
Quantitative analysis looks at specific parts of the renogram. It checks the time to peak, the slope of the phases, and how each kidney works. These details help diagnose issues like high blood pressure in the kidneys.
By looking at the curves and doing quantitative analysis, we get a full picture of kidney health. This helps find problems early.
Step 4: Assessing Lasix Nuclear Renal Scan Responses
To check how well kidneys work, we look at how they react to Lasix in a nuclear scan. This step is key to see if kidneys are doing their job right and if there are any blockages.
Normal Renal Scan with Lasix Results and Patterns
A normal scan with Lasix shows the kidneys quickly respond to the diuretic, meaning they’re working well. The kidneys should show a big drop in tracer activity after Lasix. We look for a curve that shows the tracer is being drained out quickly.
Analyzing Post-Diuretic Washout Characteristics
Looking at how the kidneys handle the diuretic after it’s given is very important. We check the time-activity curve to see how fast the tracer is washed out. A normal response is when the tracer activity drops fast, usually in 10-15 minutes after Lasix.
| Washout Characteristics | Normal Response | Abnormal Response |
| Time to Peak Activity | <5 minutes | >10 minutes |
| Washout Half-Time | <10 minutes | >20 minutes |
Differentiating True Obstruction from Non-Obstructive Dilation
Telling true obstruction from non-obstructive dilation is very important for patient care. We use the Lasix nuclear renal scan to see how kidneys react to diuretic stress. True obstruction means a slow washout even with Lasix, showing a big problem with urine flow.
On the other hand, non-obstructive dilation shows a good or almost good response to Lasix. This means the dilation isn’t causing a big problem with urine flow.
Step 5: Identifying Specific Pathological Conditions
Understanding DTPA scan results is key to spotting various kidney issues. These scans help us find specific problems that affect how well the kidneys work.
Detecting Renovascular Hypertension
Renovascular hypertension happens when blood pressure goes up because of narrowed arteries to the kidneys. A DTPA scan, with Lasix, shows if blood flow to one kidney is low. This helps us spot this condition.
Evaluating Transplant Kidney Dysfunction
For people with kidney transplants, DTPA scans check how well the kidney is working. If the scan shows something’s off, it might mean the kidney transplant isn’t working right. This lets us act fast to help.
Characterizing Abnormal Renal Scan with Lasix
An abnormal scan with Lasix might mean there’s a blockage in the urinary tract. We look at the scan closely to tell if it’s a real blockage or just a dilation. This helps us decide what to do next.
By carefully looking at DTPA scan results, we can find issues like renovascular hypertension and transplant kidney problems. This helps us give better care to our patients.
FAQ
What is a DTPA scan, and how does it work?
A DTPA scan, also known as a renal scan or renogram, is a test that uses a small amount of radioactive material. This material, called 99mTc-DTPA, helps check how well the kidneys work. It’s injected into a vein, and a special camera takes pictures of the kidneys as it moves through them.
What is the purpose of a Lasix nuclear renal scan?
A Lasix nuclear renal scan is a special version of the DTPA scan. It adds Lasix (furosemide) to see how the kidneys react. This helps find out if there’s a blockage or not.
How is GFR calculated from DTPA scan data?
GFR, or Glomerular Filtration Rate, is figured out from DTPA scan data. It looks at how fast the radioactive tracer is removed from the blood by the kidneys. This is done using software that tracks the tracer’s movement over time.
What are normal GFR values, and how do they vary with age?
Normal GFR values are usually between 90-120 mL/min/1.73m ². But, GFR goes down as you get older. So, what’s normal for a younger person might not be for an older one.
How do you differentiate between true obstruction and non-obstructive dilation on a Lasix renogram?
To tell true obstruction from non-obstructive dilation, we look at how the kidneys react to Lasix on the renogram. If they respond well, it’s likely not obstructed. But, if they don’t, it might be a blockage.
What are the common perfusion abnormalities detected on a DTPA scan?
On a DTPA scan, we often see reduced or missing perfusion. This can mean problems like renovascular hypertension, transplant kidney issues, or kidney damage.
How is renovascular hypertension detected on a Lasix renogram?
Renovascular hypertension is found on a Lasix renogram by looking at the kidney’s response to Lasix. If the response is abnormal, it could be renovascular hypertension.
What is the significance of a reduced GFR finding?
A reduced GFR means the kidneys aren’t working right. This can be a sign of many kidney problems, like chronic disease, diabetic damage, or other issues.
How is transplant kidney dysfunction evaluated on a DTPA scan?
Transplant kidney problems are checked on a DTPA scan by looking at how the kidneys take in the tracer, their GFR, and the renogram curves. Any odd results can show transplant issues or rejection.
References
- Comparison of relative renal functions calculated with 99mTc-DMSA and 99mTc-DTPA -https://www.sciencedirect.com/science/article/abs/pii/S1120179717306397


