
Limb loss is a big health issue in the United States. It affects millions of Americans. More than 5.6 million people are living with limb loss or limb difference.
The prevalence of limb loss is substantial. This means 2.3 million people have limb loss, and 3.4 million have limb differences. Every day, many amputations happen. This shows we need better care and support for those affected.
It’s important to know how limb loss varies across different US states. This helps us tackle the unique challenges and healthcare gaps.
Key Takeaways
- Over 5.6 million Americans are living with limb loss or limb difference.
- Limb loss affects 2.3 million individuals, while 3.4 million have limb differences.
- The prevalence of limb loss varies across US states, highlighting regional disparities.
- Comprehensive care and support are essential for individuals affected by limb loss.
- Understanding amputation statistics is key to better healthcare outcomes.
The Current Landscape of Limb Loss in America

Limb loss is a big health issue in the U.S. It affects many people in big ways. Looking at the current situation shows us how big this problem is.
The Amputee Coalition says about 2.3 million Americans are living with limb loss. This huge number shows how big the issue is. It also shows we need better support and healthcare for these people.
Scale of the Issue: 2.3 Million Americans Living with Limb Loss
Limb loss in the U.S. is a big problem. It’s caused by things like vascular disease, diabetes, trauma, and being born with it. The Amputee Coalition’s data helps us understand how big this challenge is.
Think about it. 2.3 million people need special care, rehab, and support. This affects healthcare providers, policymakers, and the whole community a lot.
Daily Reality: 300-500 Amputations Performed Each Day
Every day, 300-500 amputations happen in the U.S. This means a lot of people have to go through big surgery every year. Each one has their own path to recovery and rehab.
This daily number shows we really need to work on preventing amputations. We need to focus on diseases like diabetes and vascular disease. We also need to make sure there are good rehab services for those who lose a limb.
Category | Number | Percentage |
Total Amputees | 2,300,000 | 100% |
Daily Amputations | 300-500 | – |
Annual Amputations | 109,500 – 182,500 | – |
Dealing with limb loss in America needs a big plan. We need better healthcare, to prevent amputations, and to help those who have lost a limb. They need support and rehab services.
“The loss of a limb is not just a physical challenge; it’s a life-altering event that requires complete support and care.” — Amputee Coalition
Understanding Amputation Statistics Across the United States

To get a clear picture of amputations in the US, we need to look at how data is gathered and analyzed. Knowing about amputation stats helps us see the healthcare challenges faced by different areas and people.
Data Collection Methods and Limitations
Amputation data comes from national health surveys, hospital records, and insurance claims. But, how data is collected can differ a lot between states. This might cause differences in reported amputation rates. Some states might have better systems for collecting data, while others might not.
A study in the National Library of Medicine shows why it’s key to know about these data collection methods and their limits. It says that having accurate data is vital for making good healthcare policies and actions.
National Trends and Patterns
National trends in amputation stats show a complex picture. The overall rate of amputations hasn’t changed much in recent years. But, there are big differences in different groups of people. For example, older adults and those with diabetes are more likely to have amputations.
Also, some parts of the US have more amputations than others. These differences are due to many factors. Things like how rich or poor an area is, access to healthcare, and the presence of health conditions play a role.
Regional Variations in Amputation Prevalence
Looking at how amputation rates vary by region is key to understanding limb loss in the US. Some states, mainly in the South, have higher amputation rates. These differences are often because of how rich or poor an area is, access to healthcare, and the presence of diseases like diabetes.
By studying these regional differences, healthcare workers and policymakers can focus their efforts where they’re most needed. This can help lower the number of amputations and improve care for those who have them.
Top 10 States with Highest Amputation Rates
Our analysis shows that some states face a higher risk of limb loss. This issue is more common in certain parts of the United States.
Southern States Domination in Amputation Statistics
The southern United States is heavily represented in the top 10 states with the highest amputation rates. Mississippi, Alabama, and Arkansas are among the states with the highest rates. This is due to higher diabetes rates and limited healthcare access in these areas.
Urban vs. Rural Distribution Within High-Prevalence States
In states with high amputation rates, urban and rural areas differ. Rural areas have higher amputation rates. This is because they often lack access to specialized healthcare and have more diabetes and vascular disease.
Correlation with State Healthcare Systems
The state of a healthcare system affects amputation rates. States with better healthcare systems, including more preventive care and diabetes management, have lower amputation rates. On the other hand, states with weaker healthcare systems face higher rates of limb loss.
By looking at the top 10 states with the highest amputation rates, we can understand the complex issues. These include healthcare access, socioeconomic factors, and health conditions that lead to limb loss.
Demographic Analysis of Amputees by State
A detailed look at amputees by state shows us a lot. It helps us understand why limb loss happens in different places. This is key to figuring out the reasons behind amputation rates in various areas.
Age Distribution: Prevalence Among Older Adults
Most amputees are older adults. Studies show that people aged 65 and up are most likely to lose a limb. We find that vascular disease and diabetes in older people are big reasons for this.
Racial and Ethnic Disparities in Amputation Rates
There are big differences in amputation rates among different races and ethnicities. Research indicates that African Americans and Native Americans face higher rates of limb loss. These differences are often tied to healthcare access, money status, and health conditions.
Socioeconomic Factors Influencing Amputation Rates
Socioeconomic status greatly affects amputation rates. People with lower income often lose limbs because of poor healthcare access. We need to think about these factors when trying to lower amputation rates and help amputees.
By looking at who gets amputations, including age, race, and income, we can meet their needs better. This helps us work towards fewer limb losses in the U.S.
Primary Causes of Amputation in High-Incidence States
In states with high amputation rates, knowing the main causes is key. This knowledge helps in creating effective ways to prevent amputations. We look at the main reasons behind these high rates, focusing on the most common conditions that lead to amputation.
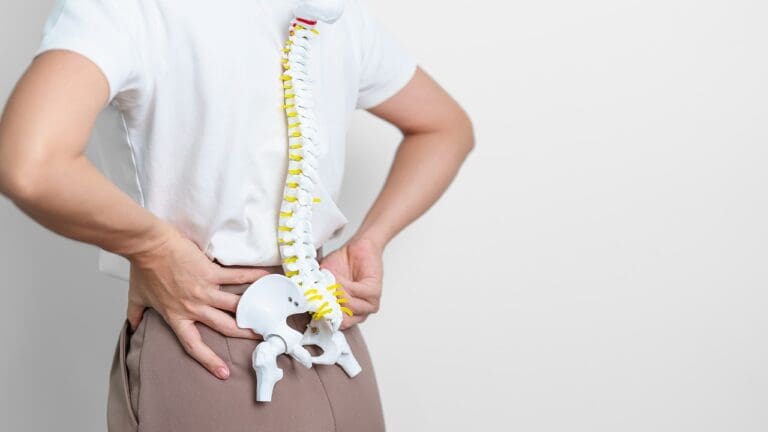
Vascular Disease: The Predominant Factor
Vascular disease is the top reason for amputation, making up 54% of cases. It includes conditions like peripheral artery disease (PAD) that harm blood flow to the limbs. The role of vascular disease in amputation rates shows how vital it is to take care of our heart health.
The effects of vascular disease on amputation rates are many:
- Less blood flow causes tissue damage and death
- Diabetes, often found alongside, makes things worse
- Smoking and not exercising increase the risk
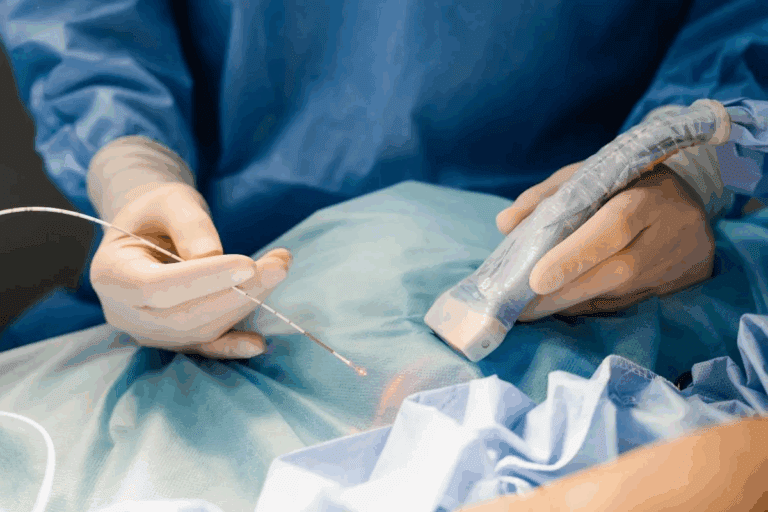
Trauma-Related Amputations: A Significant Contributor
Trauma is the second biggest reason for amputation, making up 45% of cases. It includes injuries from accidents, violence, and other severe limb damage. The high number of trauma-related amputations shows we need better safety and emergency care.
Important points about trauma-related amputations include:
- Car accidents are a major cause
- Workplace injuries, mainly in industrial settings, also contribute
- Improvements in emergency care have helped patients
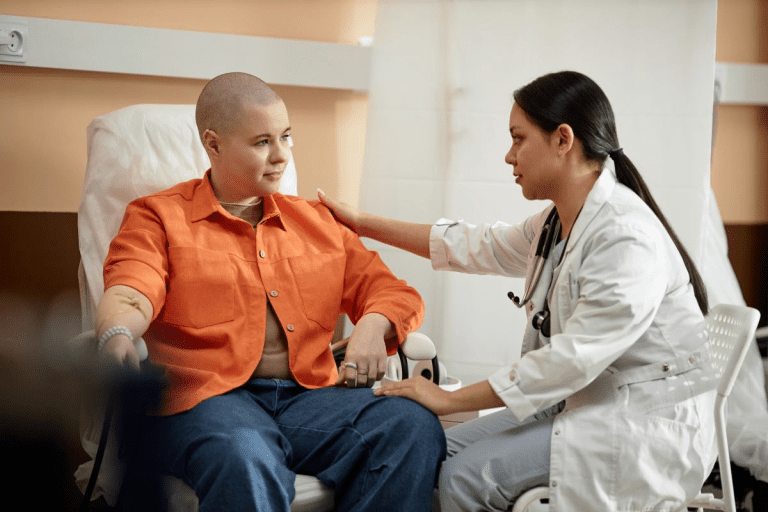
Other Causes: Cancer and Congenital Conditions
While vascular disease and trauma are the main causes, cancer and congenital conditions also play a part. These less common causes make up a smaller percentage but are important in the bigger picture.
Cancer amputations often happen when tumors in the limbs need to be removed. Congenital conditions, though rare, may require amputation due to severe limb malformations or other issues.
Knowing these main causes is vital for creating focused prevention strategies. This knowledge helps improve patient outcomes in areas with high amputation rates.
The Diabetes-Amputation Connection in Most Affected States
The link between diabetes and amputation is a big worry in the United States. It’s more pressing in states with high amputation rates. We must grasp this connection to create effective prevention and care plans.
Diabetes as a Critical Risk Factor: 57% Correlation
Research shows diabetes is a major risk for amputation, with a 57% correlation. This shows how vital managing diabetes is to avoid amputations. Poor blood sugar control can cause problems like peripheral artery disease and neuropathy. These issues raise the risk of losing a limb.
State-by-State Diabetes Management Programs and Outcomes
Diabetes management programs differ across states, affecting amputation rates. Some states have launched detailed programs with education, early action, and specialized care access. For example, Minnesota and Massachusetts have seen better diabetes management thanks to their strong healthcare efforts.
- Minnesota’s diabetes education programs have led to better patient results.
- Massachusetts has policies to boost healthcare access for diabetic patients.
Preventable Amputations: Success Stories in Diabetes Care
There are inspiring stories in diabetes care that show the power of good management and prevention. By studying these stories, we can find best practices to lower amputation rates nationwide.
A community program in a high-risk state might offer regular foot care and patient education. This approach has greatly cut down amputation rates. Such efforts highlight the need for active diabetes management.
Lower vs. Upper Limb Amputations: State Distribution Patterns
Looking at amputation trends in different states, it’s key to split them into lower and upper limb amputations. This split matters because the reasons, effects, and ways to recover from these amputations are quite different.
Lower Limb Dominance
Studies show that lower limb amputations make up 91% of all amputations in the U.S. This is mainly because of vascular diseases like diabetes and peripheral artery disease, which often hit the lower limbs.
Lower limb amputations are common in most states, with some states having more cases than others. For example, states with more diabetes cases tend to have more lower limb amputations.
Upper Limb Cases
On the other hand, upper limb amputations are much rarer, making up about 9% of all amputations. They usually happen due to injuries or birth defects. Even though they’re less common, upper limb amputations bring their own set of challenges in recovery and using prosthetics.
Geographically, upper limb amputations are more common in areas with more industrial or traumatic injuries. For example, states with big manufacturing or construction sectors might see more upper limb amputations because of work accidents.
Knowing these patterns is vital for healthcare workers and policymakers. It helps them plan better and find ways to lower amputation rates and help those who have had amputations.
Economic Impact and Healthcare Costs by State
It’s important to understand how amputations affect the economy. This knowledge helps create better healthcare policies. Amputations not only impact individuals but also healthcare systems and economies at the state level.
Direct Medical Costs Associated with Amputations
The costs of amputations are high. These include hospital stays, surgeries, prosthetics, and follow-up care. Studies show that the first year of an amputation can cost between $40,000 and over $60,000 per patient. These costs are a big challenge for healthcare systems, mainly in states with many amputations.
A study found that amputation costs aren’t just for the surgery. They also include ongoing expenses for rehabilitation, prosthetics, and long-term care. This shows the need for care that covers both immediate and long-term needs.
Prosthetic Access and Coverage Variations Across States
Prosthetic access and coverage differ across states. Some states cover prosthetics well, while others have limits or high costs for patients. This difference can lead to unequal care and outcomes for amputees. It’s important to ensure everyone has fair access to prosthetics for better quality of life.
A healthcare report said, “unequal access to prosthetic care makes it hard for amputees to reintegrate into society and stay independent.” Fixing these disparities is key to providing top-notch care.
Long-term Economic Burden on High-Prevalence States
States with many amputations face a big economic challenge. The costs of ongoing care, rehabilitation, and lost productivity are high. Managing diabetes and other amputation risks is key to reducing these costs. By focusing on prevention and early care, states can lessen the economic impact of amputations.
Healthcare experts stress, “prevention and early intervention are vital to cut amputation costs.” Creating policies and programs for prevention can save money and improve health.
Rehabilitation Services and Support Systems in States with High Amputation Rates
Rehabilitation is key for amputees. States with high rates are creating special support systems. These services help people regain their independence and adjust to life changes.
Specialized Rehabilitation Centers
Specialized centers are vital for amputees. They have the latest technology and teams of experts.
These centers offer:
- Advanced prosthetic fitting and training
- Physical therapy to improve mobility and strength
- Occupational therapy to enhance daily living skills
- Psychological support to address emotional challenges
State-Funded Support Programs
State-funded programs are key for amputees. They offer financial help, medical coverage, and job training.
Examples include:
- Medicaid for prosthetics and rehab
- Vocational programs to get back to work
- Home modifications for better access
Community Resources and Advocacy Groups
Community groups and advocacy help amputees. They guide through the healthcare system and offer support.
Some notable groups include:
- Amputee support groups
- Disability advocacy organizations
- Local non-profits for adaptive sports
Conclusion: Addressing the Amputation Crisis in High-Risk States
We’ve looked into the amputation statistics in the U.S. and found a worrying trend in certain states. It shows we need a wide-ranging plan to tackle the amputation crisis. This plan should include prevention, rehabilitation, and support.
States with high amputation rates should focus on better diabetes care. This is because diabetes is a big reason for limb loss. Also, making more rehabilitation centers and support programs available can greatly help amputees.
Understanding who is most at risk can help us target our efforts. Our study shows it’s key to fight vascular disease and trauma-related amputations. These are the main reasons for limb loss.
Going forward, we must take steps to prevent amputations. High-risk states need the right resources to deal with this crisis. This way, we can help those who have lost limbs and ease the healthcare system’s load.
FAQ
What are the US states with the most amputees?
The southern United States has the highest amputation rates. This is due to more diabetes, vascular disease, and less access to healthcare.
How many people live with limb loss in the US?
About 2.3 million Americans live with limb loss. This number is expected to grow as the population ages and more people get diabetes and vascular disease.
What is the daily number of amputations performed in the US?
The US sees 300-500 amputations every day. This shows how big of an issue limb loss is for people and the healthcare system.
What are the primary causes of amputation in high-incidence states?
In states with a lot of amputations, the main reasons are vascular disease, trauma, and diabetes. Vascular disease is the biggest cause at 54%.
How does diabetes contribute to amputation rates?
Diabetes is a big risk for amputation, linked to 57% of cases. It’s very important to manage diabetes well to prevent amputations.
What is the economic impact of amputations on individuals and healthcare systems?
Amputations cost a lot, affecting both individuals and healthcare systems. Costs include medical bills, prosthetics, and long-term care.
What rehabilitation services are available for amputees in states with high amputation rates?
States with a lot of amputations have special rehab centers and support programs. These help amputees recover and get back into daily life.
How do socioeconomic factors influence amputation rates?
Income, education, and healthcare access greatly affect amputation rates. Poorer areas face more risks because of less healthcare and bad disease management.
What is the distribution pattern of lower and upper limb amputations across states?
Most amputations, 91%, are of the lower limbs. Upper limb amputations are more common in certain areas, often due to accidents or injuries.
How do state healthcare systems impact amputation rates?
A state’s healthcare system is key to its amputation rates. Good healthcare, including diabetes and vascular disease treatment, can lower these rates.
References
National Center for Biotechnology Information. Evidence-Based Medical Guidance. Retrieved from https://www.ncbi.nlm.nih.gov/books/NBK546594/


 Departments
 Related Videos
 Our Doctors
 News
News


