
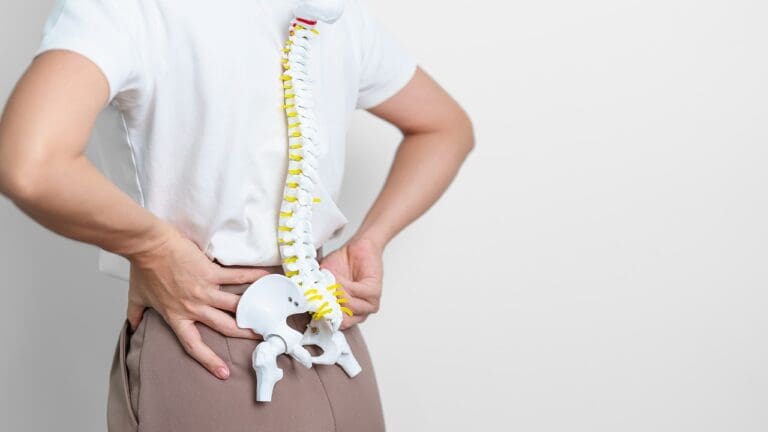
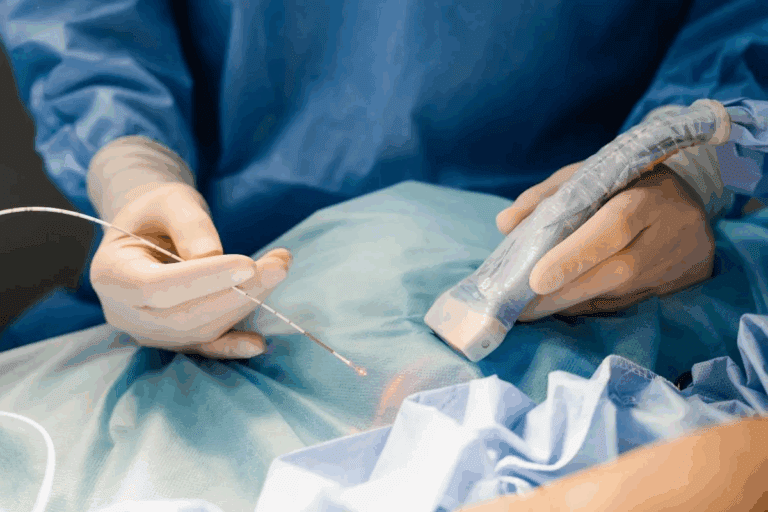
Use this BMD Z score chart to track health. The best guide to interpreting your density numbers and understanding potential fracture risks. Knowing about bone mineral density is key to understanding bone health and fracture risk. DEXA scans use low-dose X-rays to check bone density at the hip and spine. They are the top choice for measuring bone density.
By looking at DEXA scan results and Z score charts, people can learn a lot about their bones. This is very important for those worried about osteoporosis or wanting to stay healthy.
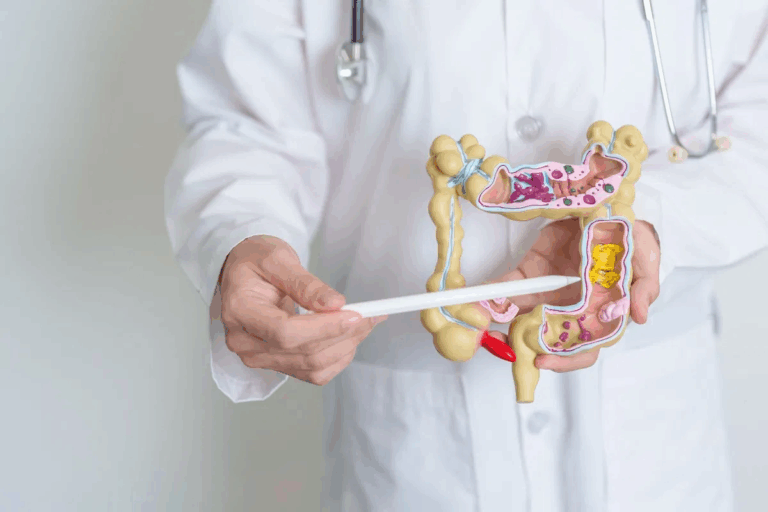
Liv Hospital offers trusted care that focuses on the patient. They use the latest methods and tools to help patients understand their bone health. This way, they can create care plans that fit each person’s needs.
Key Takeaways
- DEXA scans measure bone density using low-dose X-ray technology.
- Understanding DEXA scan results is key for knowing fracture risk.
- Z score charts give important insights into bone health.
- Liv Hospital offers patient-centered care using the latest methods.
- Personalized care plans can be made based on bone health data.
The Fundamentals of Bone Mineral Density

BMD measurements are key to checking your bone health. They show how much minerals like calcium are in your bones. This helps figure out your risk of breaking bones.
What BMD Measurements Tell Us About Bone Health
BMD tests tell us about the minerals in your bones. They use a DEXA scan, a safe test that shows bone density. A higher BMD means stronger bones, while a lower BMD means weaker bones and a higher risk of fractures.
These tests are important for spotting conditions like osteoporosis and osteopenia. They help doctors see how much bone loss there is and what treatment is best.
Risk Factors for Low Bone Density
Several things can lead to low bone density, including:
- Age: Bone density goes down with age, making older people more at risk for osteoporosis.
- Family History: If your family has osteoporosis, you might get it too.
- Lifestyle Factors: Not moving much, smoking, and drinking too much alcohol can hurt bone density.
- Nutritional Deficiencies: Not getting enough calcium and vitamin D can weaken bones.
Knowing these risk factors helps keep your bones strong and prevent bone-related problems.
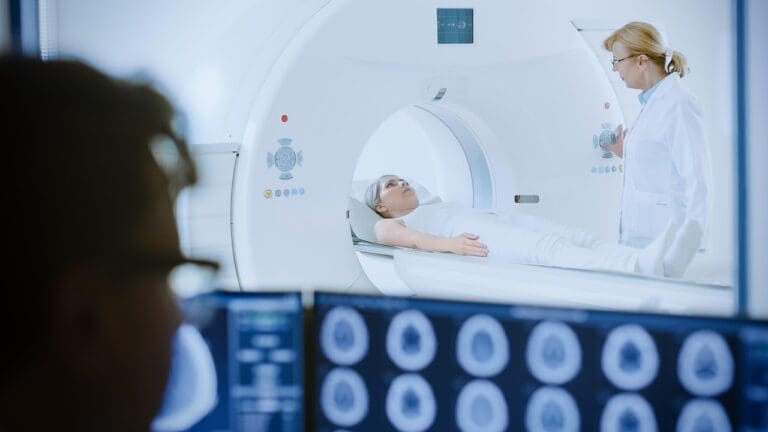
How DEXA Scan Technology Works

Dual-energy X-ray absorptiometry, or DEXA, is a cutting-edge technology for checking bone mineral density. It’s a non-invasive test that helps doctors see how healthy your bones are. It’s key for spotting issues like osteoporosis.
The Science Behind Dual-Energy X-ray Absorptiometry
DEXA scan technology uses low-dose X-rays to measure bone density. It sends two types of X-rays through the bones. The difference in how these X-rays are absorbed lets doctors calculate bone mineral density.
Key Measurement Sites: Hip, Spine, and Forearm
The DEXA scan focuses on three main areas: the hip, spine, and forearm. These spots are chosen because they’re more likely to break in people with osteoporosis.
- The hip is very important, as hip fractures can be very serious.
- The spine is also key, as spine fractures often show up first in osteoporosis.
- The forearm is checked too, mainly when other spots can’t be used.
What Happens During a DEXA Scan Procedure
During a DEXA scan, you lie on a table while the scanner moves over the chosen spots. The whole thing is painless and quick, usually done in under 10 minutes. It’s important to stay very calm and not move during the scan to get the best results.
The scan’s results help figure out your bone mineral density. This is then compared to a standard to see how your bones are doing. Knowing these results is vital for diagnosing and treating bone problems.
Understanding BMD Z Score Charts in Detail
BMD Z score charts give you a personal look at your bone health. They compare your density to that of people your age. This is really helpful for kids, young adults, and women and men under 50.
Definition and Purpose of Z-Scores
A Z-score shows how far your bone density is from the average for your age group. It helps find people whose bone density is not what it should be. This can mean there’s a health problem.
“Z-scores are key in healthcare for spotting bone problems early,” says a top osteoporosis researcher. “They help doctors decide if more tests or treatment are needed.”
How Z-Scores Compare You to Age-Matched Peers
Z-scores compare your bone density to others of the same age, sex, and sometimes race. They show if your density is higher, lower, or average compared to them. For example, a Z-score of -1.5 means your density is 1.5 standard deviations lower than average.
Interpreting Z-Score Ranges on Charts
It’s important to understand Z-score ranges to know your bone health. A Z-score between ±2.0 is normal. Scores below -2.0 might mean you’re at risk for bone problems. Scores above +2.0 could mean your bones are denser than usual, which might not be good either.
Talking to a doctor about your Z-score is a good idea. They can help you understand what it means for your health and what to do next.
T-Scores: The Standard for Diagnosis
T-scores are key in DEXA scan results to check bone density. They compare your bone density to a healthy young adult’s, of the same sex.
Comparison to Young Adult Reference Population
The T-score compares your bone density to a young adult’s average. This shows how your bone density compares to the peak in young adulthood.
Normal bone density is a T-score between +1 and -1. This means your bone density is close to the young adult average.
The Diagnostic Range from +1 to -2.5 and Below
T-scores help diagnose bone density issues. Here’s how they’re used:
|
T-Score Range |
Diagnosis |
|---|---|
|
+1 to -1 |
Normal Bone Density |
|
-1 to -2.5 |
Osteopenia (Low Bone Mass) |
|
-2.5 and below |
Osteoporosis |
When T-Scores Are Most Clinically Relevant
T-scores are key in diagnosing osteoporosis and osteopenia. They help doctors see fracture risks and decide on treatments.
Knowing about T-scores is vital for both doctors and patients. It helps make smart choices about bone health and treatment.
Average Bone Density Variations by Age and Sex
It’s important to know how bone density changes with age and sex. This helps us understand DEXA scan results better. Bone density is key to knowing if bones are healthy. Changes with age and sex tell us about the risk of osteoporosis and fractures.
Peak Bone Mass in Young Adults
Young adulthood is key for bone health. It’s when peak bone mass is reached, usually in the mid to late 20s. Genetics, nutrition, and exercise in youth affect peak bone mass. Having a high peak bone mass means a lower risk of osteoporosis later on.
Age-Related Bone Loss Patterns
Bone loss is natural with age. It can start in the fourth decade of life. Men and women lose bone differently, with women losing it faster after menopause. Knowing these patterns helps catch and manage bone health issues early.
Accelerated Bone Loss in Postmenopausal Women
Postmenopausal women face a higher risk of bone loss. This is because estrogen levels drop, which protects bones. This period is critical for monitoring and managing bone health to prevent osteoporosis and fractures.
Understanding bone density changes by age and sex helps doctors. They can give better advice, focusing on high-risk groups like postmenopausal women.
Step-by-Step Guide to Reading Your DEXA Scan Report
Reading your DEXA scan report might seem hard at first. But it’s really important. Your report gives you a lot of information about your bones. Learning how to read it can help you make better health choices.
Navigating the Different Sections of a DEXA Report
A DEXA scan report has many parts. Each part gives you different info about your bones. You’ll find patient info and scan details first. Then, there are sections on BMD measurements, T-scores, and Z-scores.
Key sections to look for:
- Patient demographics and scan information
- BMD measurements at different skeletal sites
- T-scores and Z-scores with corresponding interpretations
- Color-coded charts and graphs illustrating your bone density
Deciphering BMD Measurements and Percentages
BMD measurements are key in your report. They are in g/cm² and compared to a standard. Knowing these values and percentages is very important.
|
BMD Measurement |
Value (g/cm²) |
Percentage |
|---|---|---|
|
Lumbar Spine |
1.2 |
90% |
|
Total Hip |
1.0 |
85% |
|
Femoral Neck |
0.9 |
80% |
The table shows how BMD measurements are shown. The percentages tell you how your bone density compares to a young adult’s.
Understanding Color-Coded Charts and Graphs
Color-coded charts and graphs show your BMD results in a visual way. They help spot any issues quickly. Green means your bone density is normal, yellow means it’s low, and red means it’s very low.
By understanding your DEXA scan report, you can learn a lot about your bone health. This knowledge helps you take care of your bones and lower your risk of osteoporosis.
Normal DEXA Scan Values Explained
Knowing the normal range for DEXA scan values helps spot bone health issues early. Normal DEXA scan values are based on T-scores and Z-scores. These scores compare your bone density to a healthy young adult and your age group, respectively.
T-Score Range for Normal Bone Density (+1 to -1)
A T-score between +1 and -1 is considered normal bone density. This means your bone density is close to the average of a healthy young adult of the same sex. For example, a T-score of 0 is exactly average, and a T-score of -0.5 is slightly lower but also normal.
Z-Score Interpretation for Different Age Groups
Z-scores compare your bone density to your age group. A Z-score of 0 means your bone density is average for your age. A Z-score below -2.0 might show your bone density is lower than expected, which could mean a health issue. Z-scores change with age because bone density does too.
Site-Specific Variations in Normal Values
It’s key to look at site-specific variations in DEXA scan results. Different parts of the skeleton, like the hip, spine, and forearm, have their own normal ranges. For instance, the normal T-score range for the spine might be different from the hip. Knowing these differences helps accurately understand your DEXA scan results.
By understanding normal DEXA scan values and how they’re interpreted, you can better understand your bone health. This knowledge helps you make informed decisions about your health.
Recognizing Osteopenia and Osteoporosis in Your Results
It’s important to understand your DEXA scan results to diagnose osteopenia and osteoporosis. Knowing the diagnostic criteria and how to assess your fracture risk is key to managing your bone health.
Diagnostic Criteria for Low Bone Mass
Osteopenia is when your T-score is between -1 and -2.5. This means your bone density is lower than normal but not as low as osteoporosis. For example, a T-score of -2.0 shows osteopenia, which increases your risk of osteoporosis.
Key indicators of osteopenia include:
- A T-score between -1 and -2.5
- Lower bone density compared to the average young adult
- Increased risk of fractures
Identifying Osteoporosis
Osteoporosis is a more serious condition with a T-score below -2.5. This shows a significant drop in bone density, raising your fracture risk. For instance, a T-score of -3.0 is osteoporotic, indicating a higher risk of fractures.
“Osteoporosis is a silent disease that can lead to fractures without warning. Early detection through DEXA scans is critical for effective management.”
Osteoporosis diagnosis is based on:
- A T-score below -2.5
- Presence of fragility fractures
- Significantly increased risk of future fractures
Understanding Your Fracture Risk Assessment
Fracture risk assessment is a key part of your DEXA scan results. The FRAX score predicts your 10-year risk of a major osteoporotic fracture. It looks at your age, sex, weight, height, and BMD T-score.
|
FRAX Score Range |
Fracture Risk Level |
|---|---|
|
Below 10% |
Low |
|
10%-20% |
Moderate |
|
Above 20% |
High |
Knowing your fracture risk helps guide treatment and lifestyle changes to lower your risk.
When Z-Scores Below -2.0 Require Further Investigation
A Z-score below -2.0 is a warning sign for low bone density. It means your bones are weaker than expected for your age, sex, and ethnicity. Knowing why this is happening is key to fixing it.
Secondary Causes of Abnormal Bone Density
Many things can lead to a Z-score below -2.0. These include medical conditions like hyperthyroidism, medications like corticosteroids, and lifestyle factors like too much alcohol and smoking. Finding and fixing these causes is important for your bone health.
Some of these causes can be changed or treated. For example, changing your meds or treating health issues can help your bones. A detailed medical check-up is needed to find the exact cause.
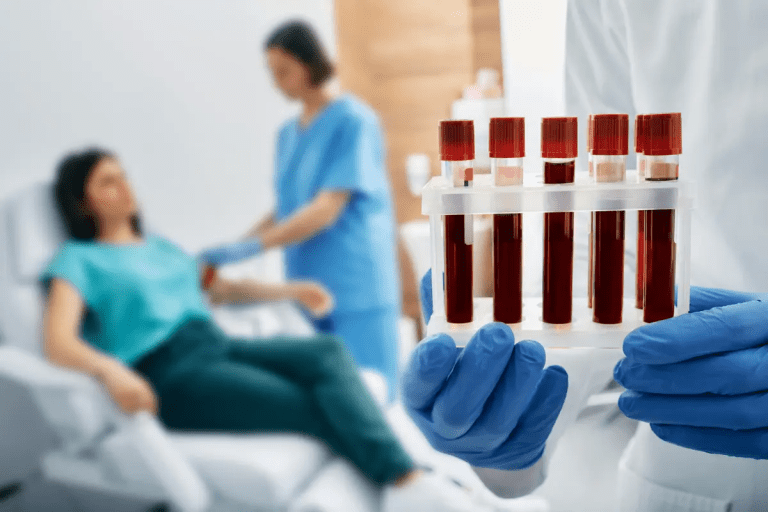
Additional Testing and Evaluation Procedures
When a Z-score below -2.0 is found, more tests are needed. This might include blood tests for vitamin D, calcium, and bone health markers. Sometimes, more images or a detailed health history review are also needed.
Your doctor might also suggest a full physical check-up. This helps find any other health risks for bone loss. It’s a way to create a plan just for you to improve your bone health.
Discussing Concerning Results With Your Healthcare Provider
If your Z-score is below -2.0, talking to your doctor is important. They can explain what your results mean and what to do next. You’ll discuss the possible reasons for low bone density, the need for more tests, and treatment options.
You and your doctor can work together to improve your bone health. This might include changing your lifestyle, eating better, or taking medicine. The goal is to strengthen your bones and lower the risk of breaks.
Bone Densitometry Accuracy and Limitations
It’s important to know how accurate bone densitometry is. This method, mainly through DEXA scans, is key for checking bone health. But, like any tool, it has its own limits and errors.
Factors Affecting DEXA Scan Reliability
Several things can affect how reliable DEXA scans are. The machine’s calibration and the technician’s skill are very important. Machine calibration ensures accurate readings. The technician’s expertise is also key for correct patient setup and machine operation.
Body size and composition can also play a role. For example, people with a higher BMI might face challenges in getting accurate BMD scans.
Comparing Results From Different Machines
It’s hard to compare DEXA scan results from different machines. This is because different machines might use different standards. It’s best to use the same machine for follow-up scans to track changes accurately.
Common Sources of Measurement Error
DEXA scans can have errors due to several reasons. Improper patient positioning, machine malfunctions, and artifact presence are common issues. Proper training for technicians and regular machine checks can help avoid these problems.
- Improper patient positioning can lead to inaccurate BMD measurements.
- Regular quality control checks can help identify and rectify machine malfunctions.
- Artifact presence, such as from previous surgeries or foreign objects, can affect scan accuracy.
Conclusion: Taking Action Based on Your BMD Results
Understanding your BMD results is key to knowing your bone health and fracture risk. By looking at your DEXA scan and Z score charts, you can make smart choices to keep or boost your bone density.
If your results show low bone density or osteoporosis, talk to your doctor about treatment. They might suggest changes in your lifestyle, like more exercise or better nutrition, or prescribe medicine to lower your fracture risk.
Acting on your BMD results can greatly improve your bone health. Regular check-ups and taking steps early can stop fractures and keep your bones strong as you get older.
Being proactive about your bone health can lower your chance of osteoporosis and fractures. Talk to your doctor to find out the best steps for you based on your DEXA scan and your unique situation.
FAQ
What is a DEXA scan, and how does it measure bone density?
A DEXA scan, or dual-energy X-ray absorptiometry, is a non-invasive test. It uses low-level X-rays to check bone health. It’s key for spotting osteoporosis and osteopenia.
What is the difference between a T-score and a Z-score in DEXA scan results?
A T-score compares your BMD to a young adult’s. A Z-score compares it to someone of your age. T-scores help diagnose osteoporosis. Z-scores show if your bone density is off for your age.
What is considered a normal bone density T-score?
A normal T-score is between +1 and -1. This means your bones are healthy. Scores between -1 and -2.5 show low bone mass, or osteopenia. Scores below -2.5 mean you have osteoporosis.
How do I interpret my Z-score results?
Z-scores are based on your age and sex. A Z-score under -2.0 might mean you have a medical issue. You might need more tests to find out.
What are the risk factors associated with low bone density?
Low bone density risks include age, sex, and family history. Being underweight, smoking, and drinking too much alcohol also increase risk. Certain health issues, like hyperthyroidism, can also play a part.
How often should I get a DEXA scan?
How often you need a DEXA scan depends on your health and risk factors. Women over 65 and men over 70 should get one every 2-5 years. Your doctor will tell you when to get one.
Can DEXA scan results vary between different machines?
Yes, results can vary slightly between machines. But modern DEXA machines are set to give consistent results. Your doctor will consider this when looking at your results.
What are the implications of having a Z-score below -2.0?
A Z-score below -2.0 might mean you have a medical issue. Your doctor might suggest more tests to find out why.
How can I improve my bone density?
To boost bone density, make lifestyle changes. Exercise regularly, eat a diet full of calcium and vitamin D. Avoid smoking and drinking too much alcohol. Your doctor might also suggest medications or supplements.
Are DEXA scans reliable for measuring bone density?
DEXA scans are a trusted way to measure bone density. But, results can be affected by machine settings, how you’re positioned, and some health conditions.
Reference
National Center for Biotechnology Information. DEXA Scan Z-Scores: Interpreting Bone Mineral Density Results. Retrieved from https://pubmed.ncbi.nlm.nih.gov/30503282/


